
There was considerable interest in yesterday's story on GDP per capita (expressed in PPP terms) in the EU for 2018, which noted the difference between east and west Slovenia, as well as the latter's integration into the area of richer regions stretching north, likely fuelled by the manufacturing might of Germany.
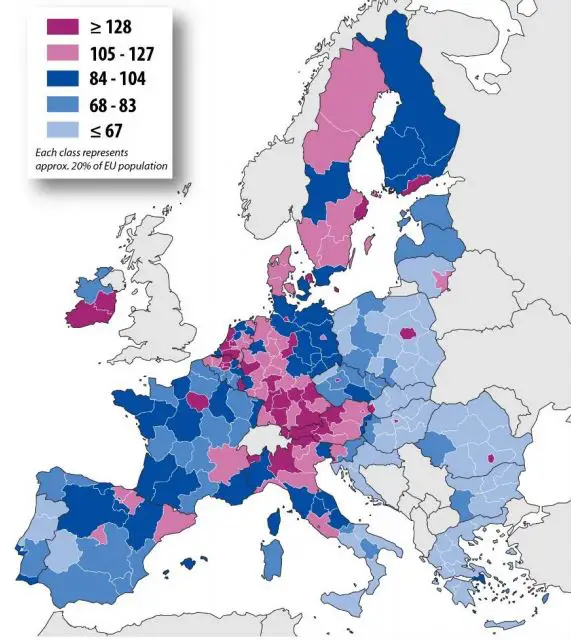
The map from yesterday's story. Source: Eurostat
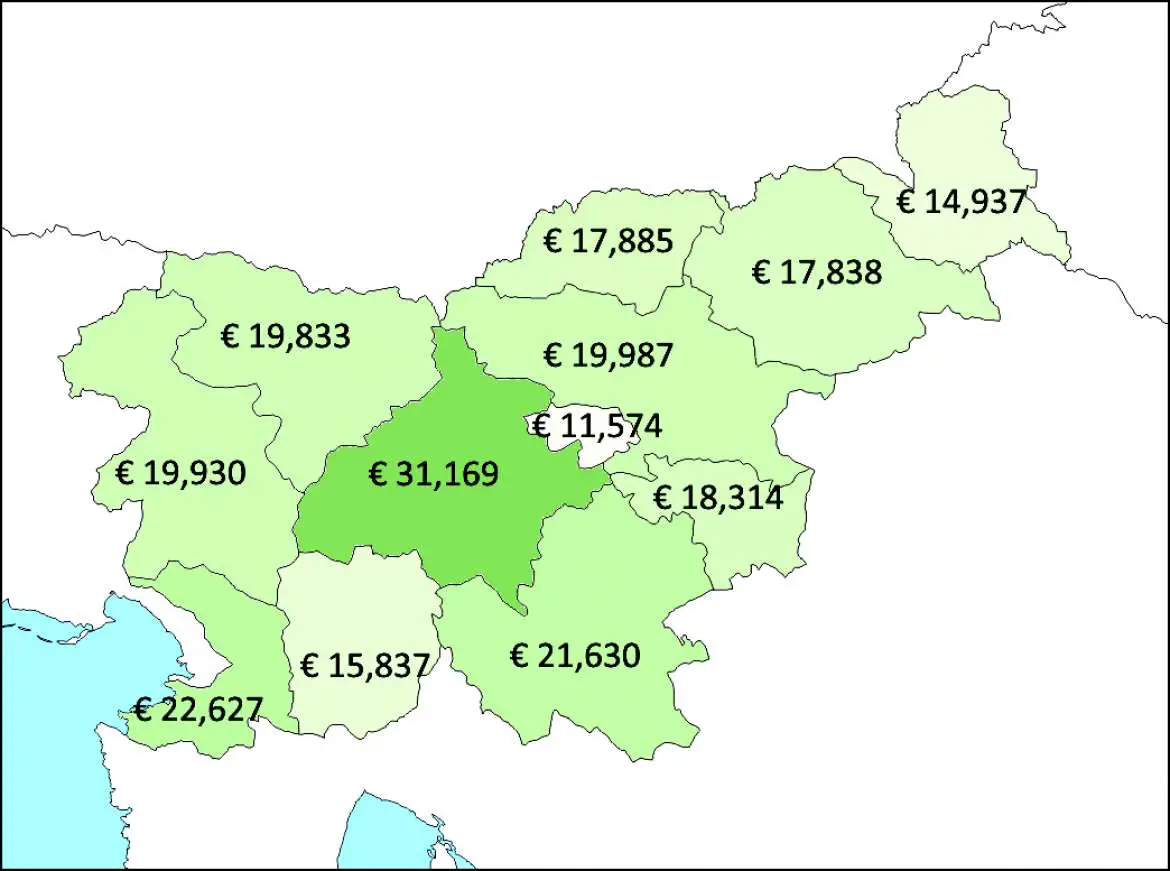
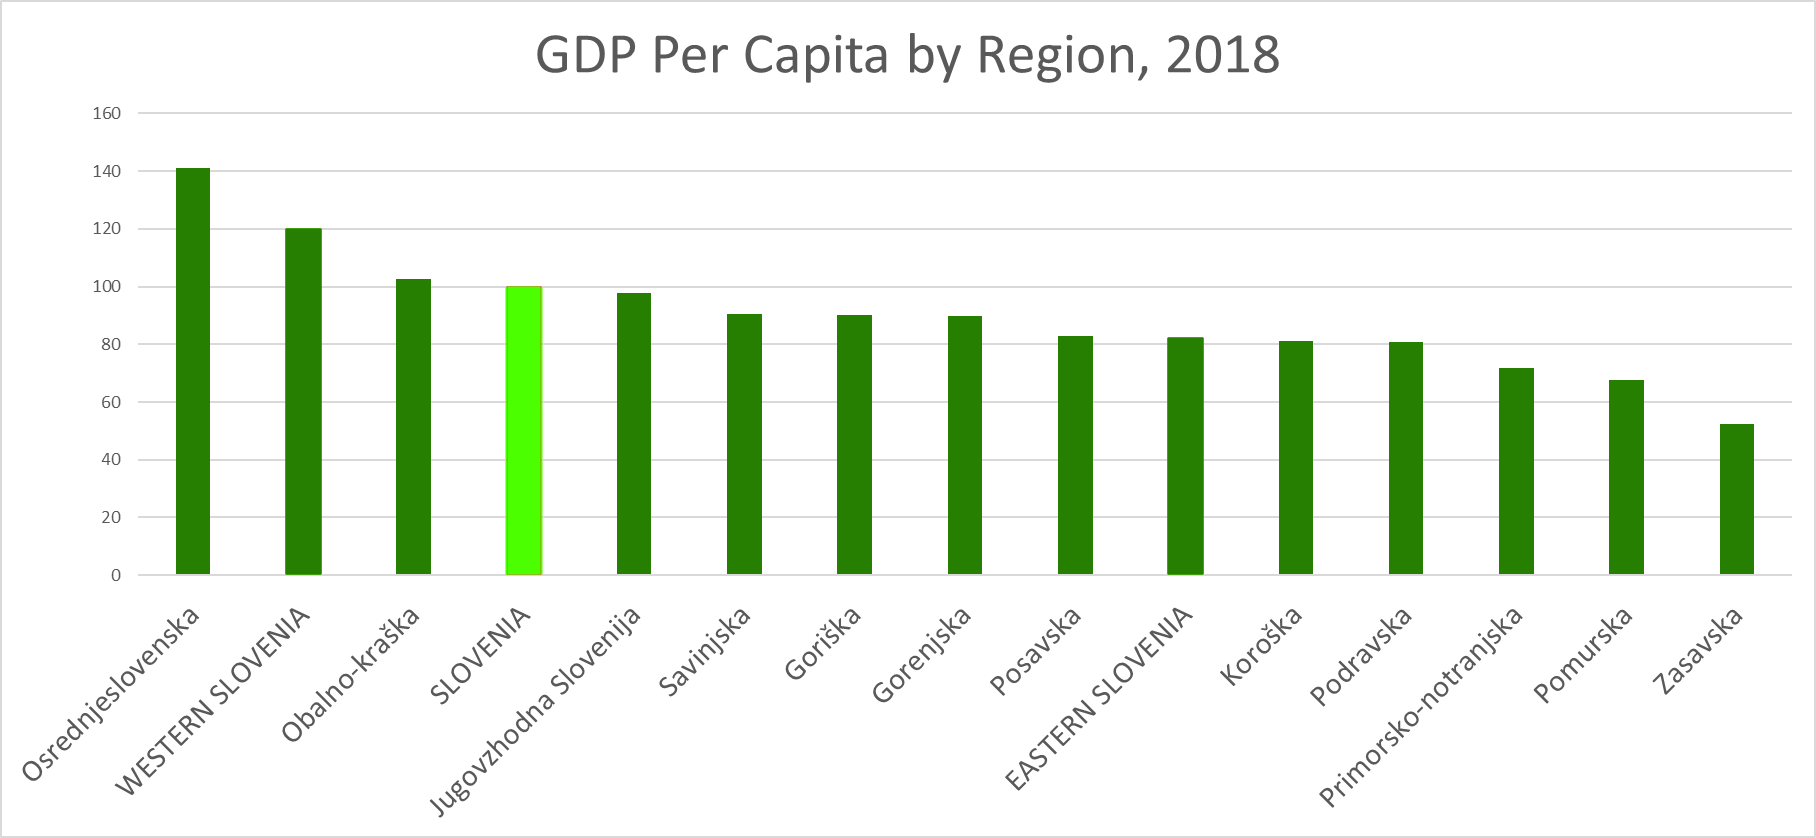
So today we dig a little deeper into the GDP per capita data for Slovenia’s 12 statistical regions in 2018, as released by SURS. The map at the top of the page tells the story, as does the following chart, revealing that Osrednjeslovenska – the centre of the country, with Ljubljana – has 141.1% the average GDP per capita for Slovenia as a whole. The coastal area, Obalno-kraška, is the only other region to be above average, at 102.5%. The poorest region in this regard is Zasavska, with just 52.4% of the average GDP per capita.
If you’d like to dig deeper into the differences between the 12 statistical regions and 212 municipalities, then you can learn how to do so here. If you want to see how Slovenia’s GDP ranked against other formerly communist countries in Europe in the period 1992 to 2017, then you can do that here.