
8 January, 2020 - Slovenia’s declaration of independence on 25 June 1991 came just a few months before the fall of the Berlin Wall in November, and the ensuing collapse of the post-World War 2 order in Europe. While there were many differences between East and West, and many reasons for the break-up of Yugoslavia and end of the Soviet Union, economics undoubtedly played a key role, and living standards a much-watched indicator of the success, or failure, of the transition to a market economy. Although, once again, note that Slovenia (as part of Yugoslavia) was not a member of the USSR, and operated a different, more open and non-aligned form of socialism than that seen behind the Iron Curtain.
Still, how have the various economies of post-communist Eastern and Central Europe fared in the three decades since opening to the world? One way to look at this is with the following video, which shows the GDP per capita from 1992 to 2017 for the top 10 nations included in the data. The GDP is presented in US dollars and Purchasing Power Parity (PPP) terms, a measure that considers the crude income compared to the prices of goods in the different countries. As such, it’s seen as a good measure of relative affluence, and for comparing the economic productivity and standards of living between different nations
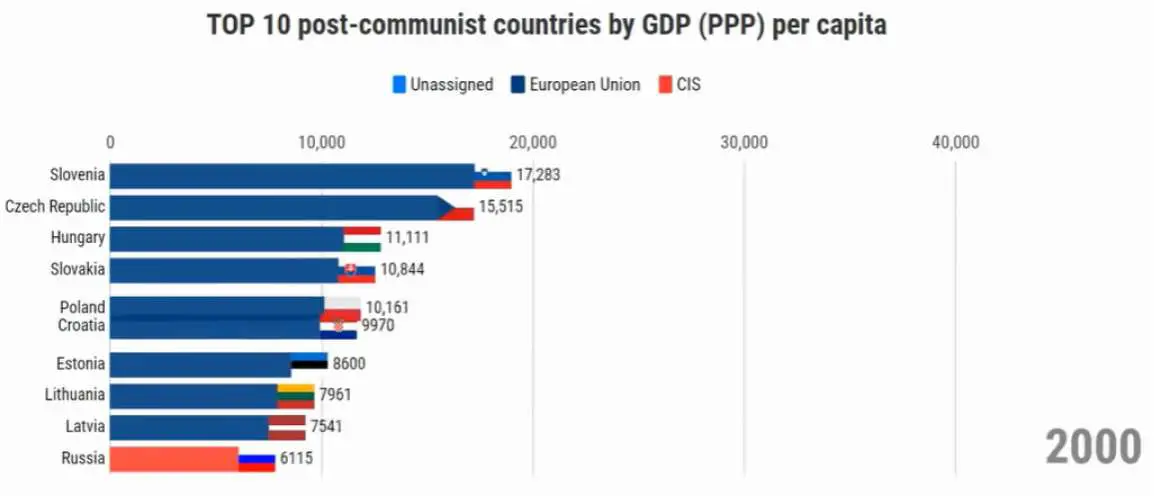
It’s best and most fun to just watch the video, and see how nations rise and fall over time, but in summary: Slovenia starts at #2, slightly behind the Czech Republic (aka Czechia) in 1992. These two then stay at the top, very close together, until 1998, when Slovenia takes pole position. After this, Slovenia pulls ahead, soon maintaining a lead of some US$2,000 until 2007, when Czechia closes the gap, then takes over the top spot in 2009. Slovenian then regains #1 for 2010 and 2011, but after that Czechia is in the lead.
Another way to look at this data is to zoom out and put Slovenia among the all the other EU Member States, with the country having joined the organisation in 2004. It’s on watching this you may have some questions about Luxembourg, with a population just under a third that of Slovenia.
Note that the first the video was produced by Lionwork Statistics, and was released with the following notes:
- There was no data available for Slovenia, Croatia, Latvia, Lithuania, and Estonia until 1995. In these cases, the average growth rate of the nearest region was used to calculate the estimated value. In the case of Estonia, data are shown from 1993, since no similar region is present due to geographical placement.
- The comparison includes Albania, North Macedonia, Montenegro, Serbia, Bosnia and Herzegovina Slovenia, Lithuania, Latvia, Estonia, Hungary, Slovakia, Czech Republic, Poland, Croatia, Bulgaria, Romania, Moldova, Belarus, Russia, and Ukraine. Some never made it to the Top 10 during the time period.